
Critical Review of a Digital Humanities Platform or Tool
In the field of Digital Humanities, researchers always have had access to various types of tools and platforms that can be used for their works and that can perfectly adapt to the human’s needs.
Since “the brain works by making patterns, this process can be visualized through a medium called visual tools” (Hyerle, 1996), timelines, within the branch of Visualization Tools, operate as a resource that allows users to understand historical trends in a contextualized and well-organized way.
The standout feature of timelines lies in their ability to offer a visual framework of the topic under examination, which is incredibly useful for both research and scholarly purposes, making it easier to work with a large quantity of data.
Gathering information
The platform that I’ve decided to explore and review is Timeline JS, an interactive tool designed by Knight Lab, a community of developers, designers, educators and students of Northwester University.
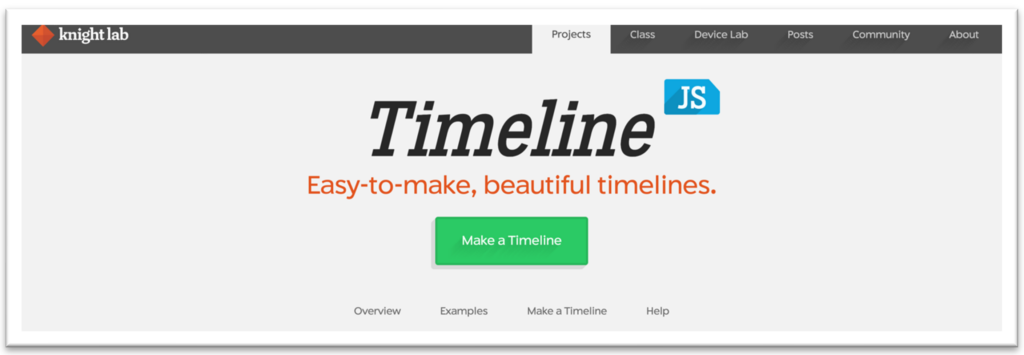
The website is simple and clearly built. Right after the name of the tool and its slogan, “Easy-to-make, beautiful timelines” there’s a green button that users can press to go immediately to the project-making section.
Scrolling down a bit further, there’s a first example of the types of works that can be made with Timeline JS. Following that, there’s a short description of the tool, illustrating that it is perfect for both beginners and experts. A brief video tutorial, tips and tricks, and media sources follow right after.
A handy 4-step guide is then available next, or can be directly accessible by pressing the green button at the top of the webpage, followed by a help section, technical documentation and frequently asked questions.
The tool has been reviewed several times on different websites, ranging from tech and educational blogs to universities’ webpages around the globe, and WordPress documents. I’ve read and particularly appreciated an article published on Digital Humanities Toolkit, a website specifically designed to provide information and reviews on common Digital Humanities tools. The article exposed the tool’s features, how to get started, its limitations, and a tutorial.
Getting started is very simple. There’s no need to download anything since it is an online platform and there are no costs linked to it; it’s completely free.
The only things you’ll need to start are a Google Account, a copy of the Google Sheets template (which is available on the website) to work with the timeline, and, in the end, links to images, videos and any other type of media that can enrich the project.
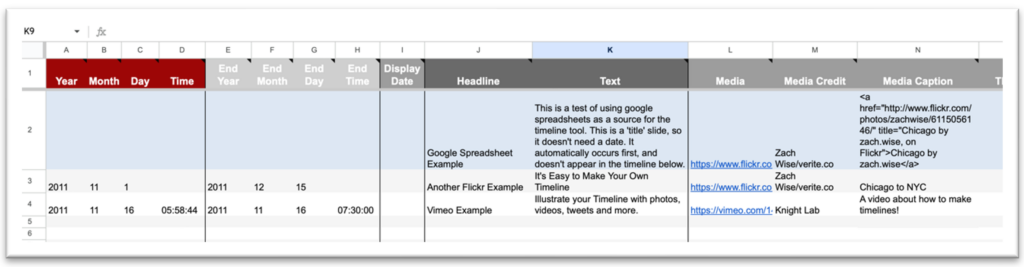
Once you got the template, you can start edit it.
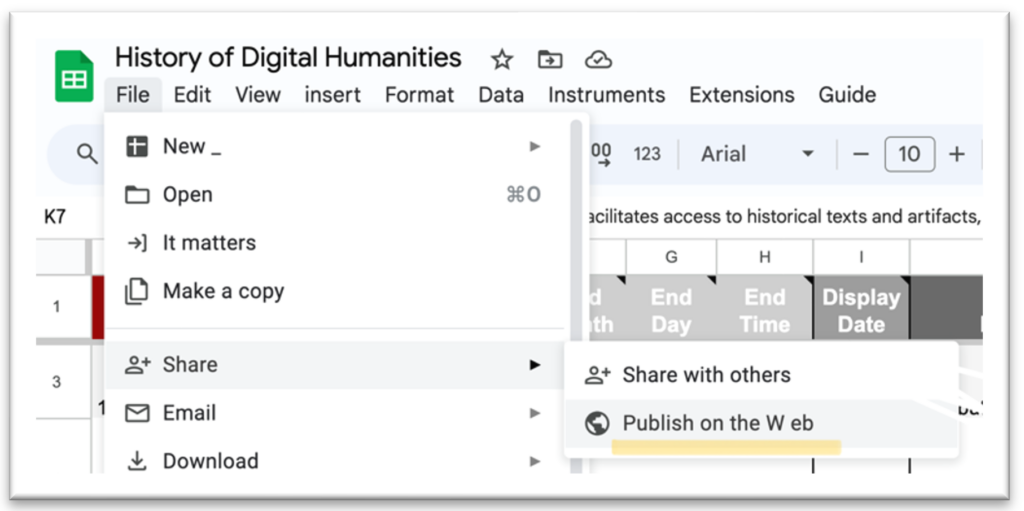
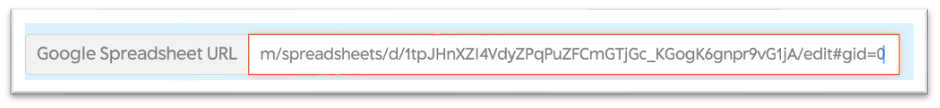
As soon as the project is done, the next step will be to share it and make it available for the web. Lastly, it will be necessary to copy the link of the Google Sheet.

The link has to be pasted into the box on the webpage of Timeline JS. Optional settings such as language, fonts, starting slides, and more can be personalised.
Once this last step is done, a preview of the timeline is ready at the end of the webpage.
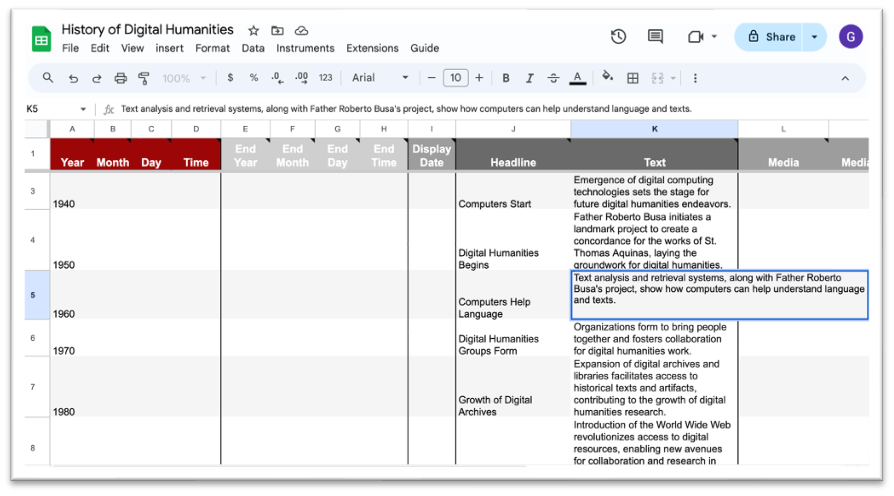
I’ve been able, following the guide on the webpage, to create a timeline on the history of Digital Humanities.
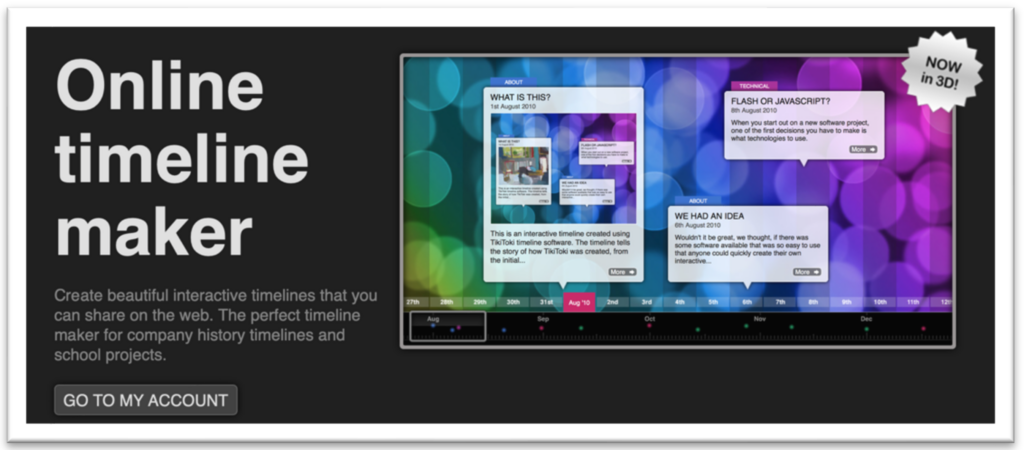
Similar tools to this one are available online. With an quick search in browser, numerous results will pop up. The first one that I’m analysing is Tiki-Toki, an online timeline maker. This tools offers various features, including a 3D timeline maker and interactive multimedia timelines, with YouTube and Vimeo videos.
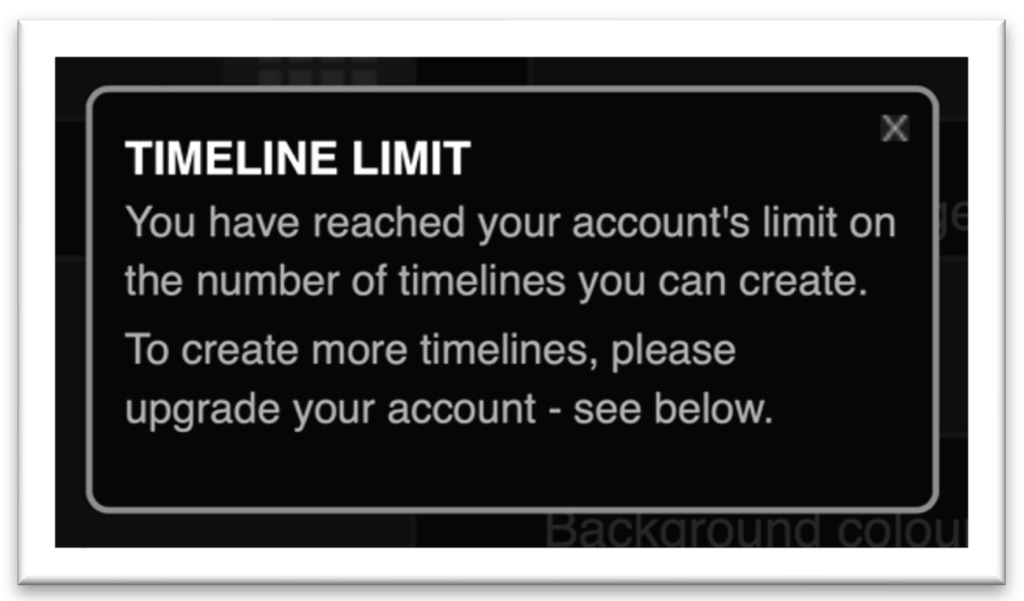
Like Timeline JS, Tiki-Toki operates with the browser, accessible by singing up for an account. The free account option is available for users with limitations; it only permits one project. If users wish to work on more projects, they have the option to upgrade to a Bronze account, for €7.50 per month, allowing for up to five projects, or to the Silver account for €9.50 per month, which permits up to twenty-five projects. Additionally, the source also offers a Teacher Account option, providing one Silver account for the teacher and 50 Bronze accounts for the students, priced €150.00 per year.
The strength of Timeline JS compared to its competitors is that there’s no limited numbers of timelines that can be created, and all of the features are free and open access to everyone. Additionally, since the timeline is created with Google Sheets, the link can be easily shared with everyone.
Moreover, based on my personal experience, the home page of this tool didn’t appear to be the most captivating and welcoming. Also, the features didn’t seem as intuitive as those from the other platform, making the overall user experience less functional.
The next tool that I’m examining is Preceden. It is an online timeline maker that creates roadmaps and timelines, suitable for professionals and students seeking for a tool that enables effective communication with others.
Two options are available for this tool: the manual one and the one generated with AI.
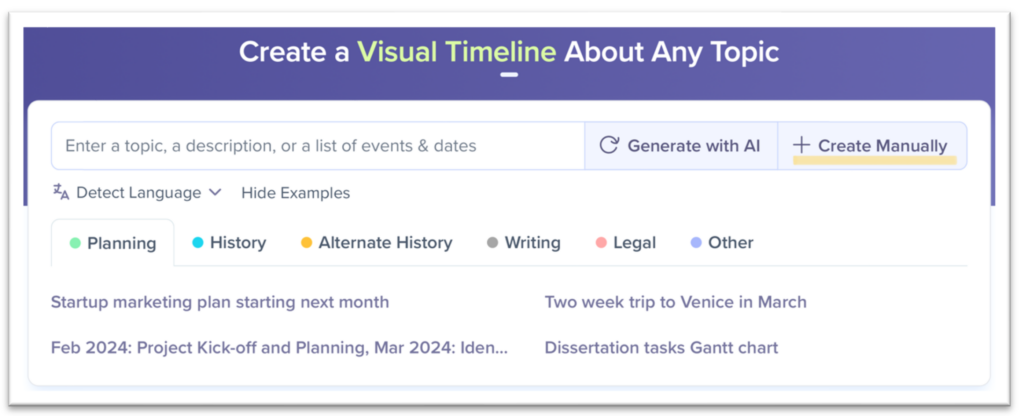
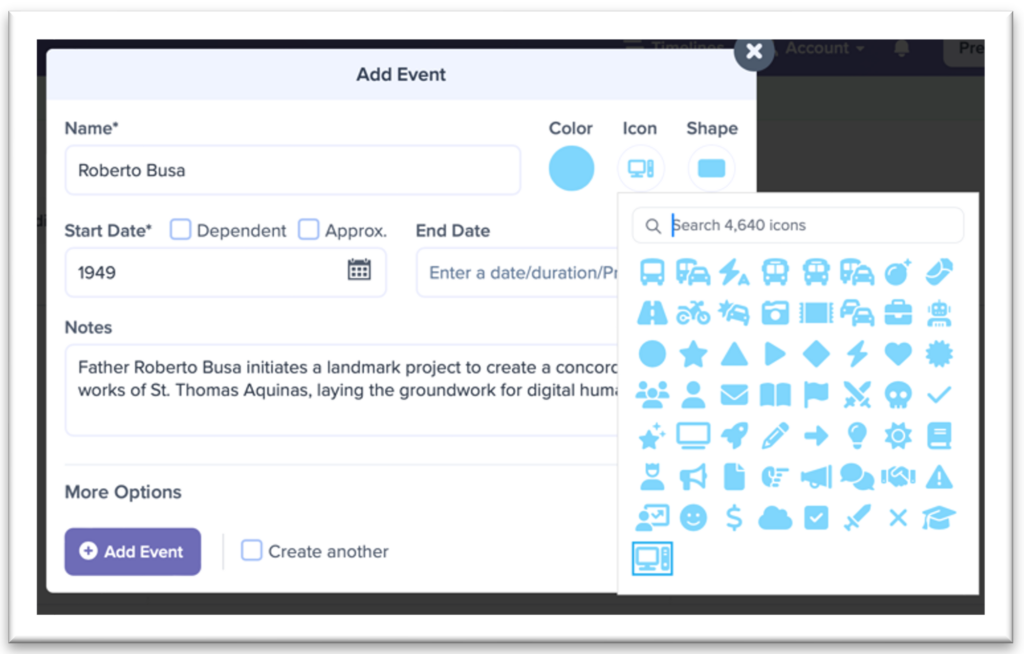
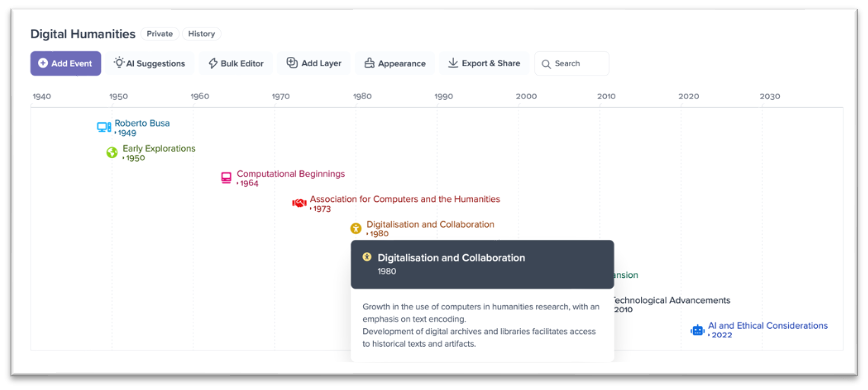
The one that I’m focusing on is the manual one, and as soon as I started working with it, I was impressed by how intuitive and quickly the creation of the timeline was. The clean design and the customization options, by colour, icon, and shape, made the experience very enjoyable and immersive.
Overall, the free plan of the platform has limitations on the number of events that can be added, up to 10. Additionally, it is not possible to import spreadsheet and make projects collaborative. If the user wishes to unlock more features, it is necessary to upgrade to a Basic Plan for €10 or a Pro Plan for €16 per month.
Clearly, the features are making this tool very appealing, but to create a timeline that can accommodate all of the information that I need for my project on the history of Digital Humanities, I would need an upgrade. For this reason, I still feel like Timeline JS is the better option.
Lastly, I want to review MyLens, a free AI that generates timelines of key events for any topic with just one click.
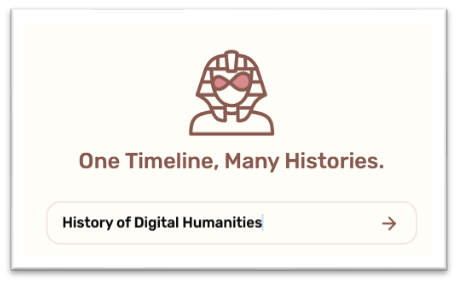
Advantages of using this AI are understandably due to the fact that is quick, open-access, free, and sharable or downloadable by singing in for an account.
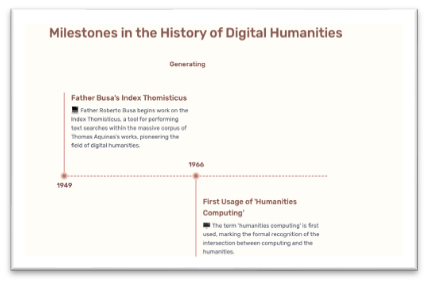
“Milestones in the History of Digital Humanities” the timeline created by the AI, is a valid work, but it can’t be edited or personalised. The sources used for the timeline obviously come solely from the web, and the creative input for the user is highly reduced.
Maturity/stability of the tool
Timeline JS, developed by the Northwester University Knight Lab, it’s now on its 3.3.14.0 version and is compatible with all modern web browsers. It is released under the Mozilla Public License (MPL), version 2.0, meaning that the platform is free to be used however you like. Users can have the freedom to publish stories, modify them according to different needs, and share it without needing to pay any fees or get special permission.
Across online forum and discussions, users express approval for the platform’s excellent service and overall ease to use. With an average rating of 3 or 4 stars across various platforms, users really appreciate its effectiveness.
Furthermore, it stands out with a high value for money rating, particularly notable since it’s a free service. The common positive feedback emphasizes the platform’s reputation and its capacity to fulfil the needs and expectations of its users. It is clearly one of the preferred choices among the consumers, thanks to its intuitiveness and reliability.
Sustainability of the tool
The strong community around this open-source tool is supported by the developers, designers, educators and students of Northwester University, who converge together in the Knight Lab. Additionally students, educators and researchers around the globe, are highly active consumers of the platform.
Another plus point is that sharing the work done is very simple. As soon as the timeline has been created using the first link and the conversion box, the website will automatically generate a second link to copy and paste, making the timeline appear everywhere the link is pasted. Additionally, there is a third link that will make the timeline appear as a YouTube video.
Sustainability of the research
Working with the tool was simple and smooth since there was a clear track for each step that I needed to follow in order to create my timeline.
I needed to pay more attention to some small details, like not changing the column headers, not removing them, and not leaving any blank row in the spreadsheet. In addition, I needed to get the Google Doc’s document link to put in the conversion box, and not the one that appeared when I made the spreadsheet public.
All of these potential mistakes by the users are anyway noted in the instruction list.
Everything that I’ve created is easily reproducible by everyone who has access to the same tool and the same sources that I’ve used for my research. Results can be edited by anyone who possesses the Google Sheet link, allowing for collaborative editing and ensuring verifiability.
Usage
I personally feel like inclined to recommend using this tool to my peers, especially because it’s freely accessible. Even though the aesthetic of the final product may not be as charming as other tools, like Preceden, for example, which I’ve reviewed before, it is still a very appealing tool.
For this reason I believe that it would be beneficial improve the design of the final work, making it more contemporary and following the contemporary trends.
I would also suggest adding the option to download the final work in PDF or PNG format since this option is not available. Furthermore I would propose adding the feature to display the entire timeline on the same page as a linear image instead of as a presentation that has to be scrolled right.
Despite this suggestions, I truly believe that the accessibility of the Timeline JS, as it can be used by anyone with access to a browser, Wi-Fi connection, and a Google account, offers more than enough functionality to start exploring this powerful type of visual tool.